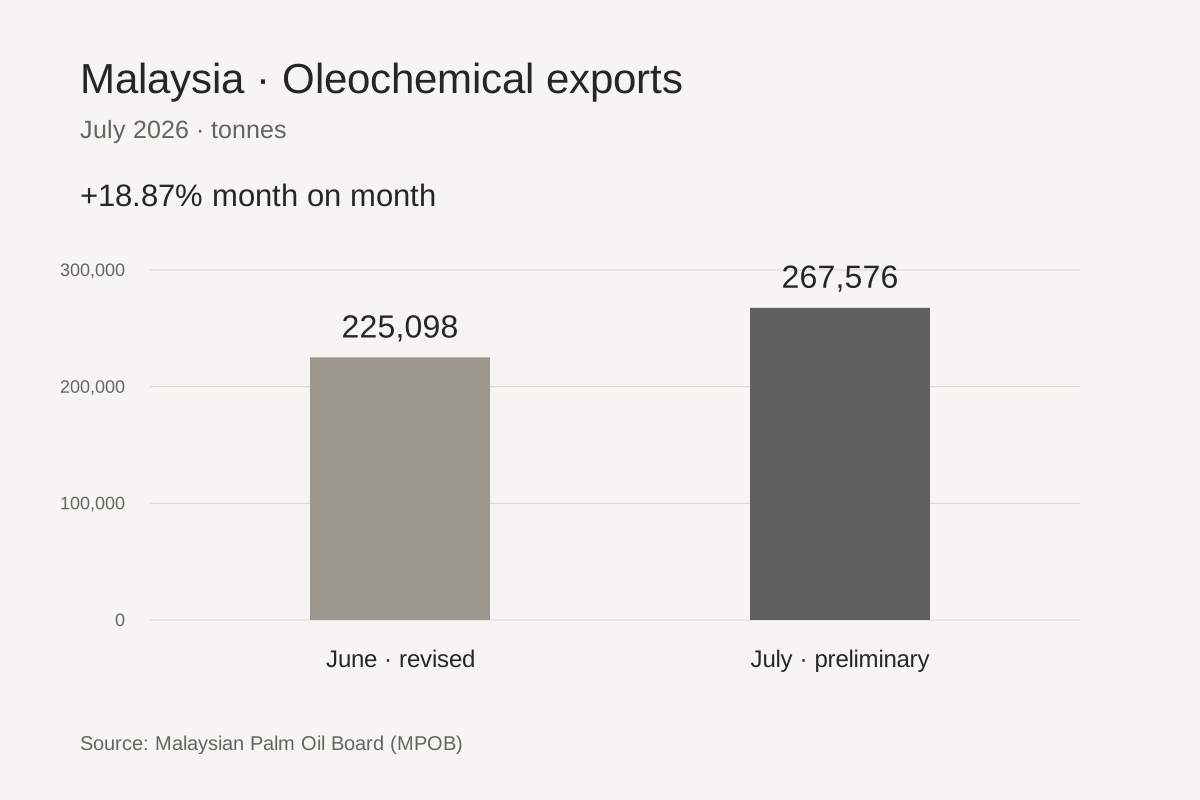


The Malaysian Palm Oil Board (MPOB) has released preliminary July 2026 data and revised its June figures. July production, exports and end-month stocks all increased from June, with exports growing faster than production and stocks.
Historical data: July preliminary and June revised figures as published in August 2026. The source page is updated with subsequent monthly releases.
July production, exports and stocks
Key Malaysian palm oil indicators: June vs. July
Compare within each indicator; each row has an independent scale, and all values are in tonnes
Source: Malaysian Palm Oil Board, Summary of the Malaysian Palm Oil Industry 2026.
Concurrent changes in production, exports and stocks
Simultaneous increases in production and exports indicate more active production and overseas sales in July than in June. Rising end-month stocks show that exports and other outflows did not fully offset additions during the reporting period. This is an industry-wide relationship, however, and does not establish available inventory for any particular grade, package or supplier.
In absolute terms, July crude palm oil production increased by 154,183 tonnes from June, palm oil exports by 183,729 tonnes, and stocks by 84,495 tonnes. Export growth exceeded production growth, yet stocks still rose. Stock movements also reflect opening inventories, imports, refining, domestic consumption and flows among different oils, and cannot be explained simply as production minus exports.
Using the published figures, July exports were about 78.1% of crude palm oil production, up from about 74.2% in June. This ratio is not an official supply-demand measure or a measure of stock coverage; it shows only that exports grew faster than production and excludes palm kernel oil, processing and domestic consumption.
MPOB's stock definition covers relevant physical quantities at mills, refineries, storage and transport facilities, oleochemical plants and biodiesel plants. It does not provide the variety, specification, packaging, loading port, payment currency or delivery window for individual transactions.
Palm oil aggregates and individual oleochemicals
Palm oil is an important upstream feedstock for many oleochemicals, so changes in production, exports and stocks inform discussion of fatty acids, fatty alcohols and glycerine. However, refining margins, processing-plant utilization, co-product balances, inventory mix and regional freight costs stand between aggregate palm oil data and individual oleochemical products. There is no direct one-to-one relationship.
MPOB's monthly report describes upstream industry totals. Supplier production schedules, delivery windows, port timing and product quotations are transaction-specific information. The current release does not provide product purity, packaging, quantity, origin or payment terms.